
|
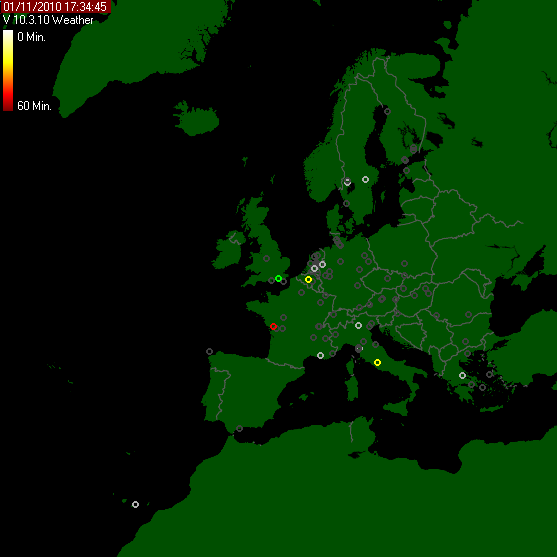
The following image shows when the same lightning strike has been observed from two or more sites, the location of the strike is caclulated by tringulation of two ligntning radar sites. |
|
 |
|
|
|
 |
|
|
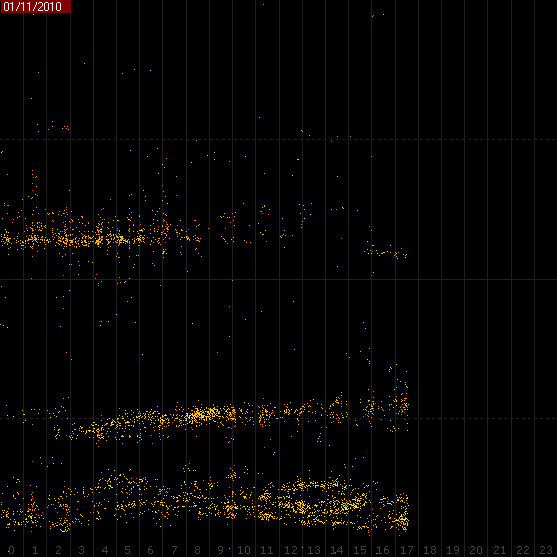
The following image shows the number of strikes with respect to time the horizontal axis gives the time of day 0:00:00 at the left, 23:55:59 at the right. The vertical axis is the direction towards the lightning discharge. At the top is true north 0 degr. and at the bottom is south, 180 degr. The color of the dots indicate the signal strength. Dark red is -50 dB light blue is -30 dB |
|
 |
|
|
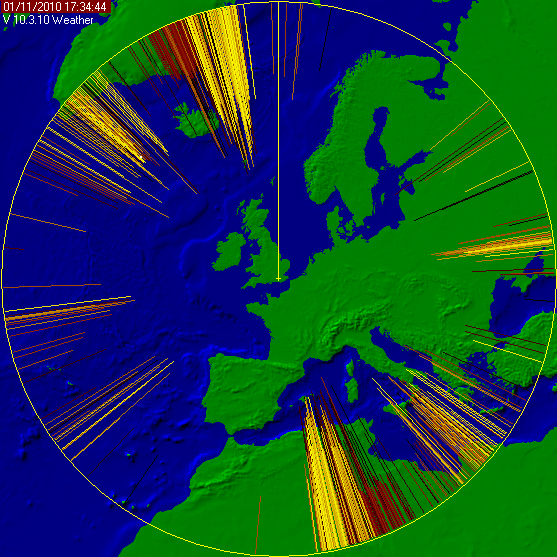
The following image shows how well the remote lightning radar is syncing with the local station, It should have three vertical lines. If not then the syncing is not good, and the trianglation will not work. |
|
 |
Main Menu
Weather Station Menu
Lightning Radar Menu
Interests
Raspberry Pi Menu
Home Automation Menu
Gallery Menu
Visitor Counter
 69.5%
United Kingdom of Great Britain and Northern Ireland
69.5%
United Kingdom of Great Britain and Northern Ireland
 12.4%
United States of America
12.4%
United States of America
 3.6%
IANA Special-Purpose Address
3.6%
IANA Special-Purpose Address
 2.7%
France
2.7%
France
 2.1%
Singapore
2.1%
Singapore
Total:
54
Countries
003358
Today:
14
This Week:
77
This Month:
255
Total:
3,358
|
Saturday, 27 April 2024 10:28
|